And your favorite new feature in Ubuntu Intrepid Ibex is … ?

Hey. As I am giving a little interview tomorrow about new features in Ubuntu Intrepid and’ll held two small lectures about the same topic my question to you is: What is your favorite new feature in Ubuntu Intrepid Ibex? Think, I like the new userland encrypted Private directory a lot, but also the new OpenSSH 5.1 version. But that’s just my taste – and yours? Are there – besides the widely known new features – things you’ve long been waiting for? Let my know by dropping a line in the comment field.

Having fun with OpenSSH on Ubuntu Intrepid Ibex – visual host keys

After having a quite uneventful upgrade to Ubuntu Intrepid Ibex (time for a change), I’s happy to notice, that Intrepid Ibex ships the new OpenSSH version 5.1 which has one little feature, I really fell in love with: visual host keys. You might already have read about it on Planet Ubuntu. In case you don’t: „visual host keys“ is a way presenting the ssh client user a 2d ascii art visualation of the host key fingerprint. It shall help you to recognize a ssh server by remembering a figure rather than the host key.

If you want to give this a try, call the ssh client this way:

$ ssh -o VisualHostKey=yes your.host.name
Host key fingerprint is ff:aa:a8:dc:0b:5e:e3:9f:96:f1:75:d4:24
+--[ RSA 1024]----+
|            +o   |
|             o. .|
|            E  + |
|       .   . .. .|
|      . S   ..   |
|   . o o..  . .  |
|    + + .+.. .   |
|   . + ooo.      |
|    . ooo        |
+-----------------+

Nice, isn’t it? Now try your different ssh hosts and compare the figures. Hope you don’t start generating ssh host keys for getting a special figure, do you? :) Actually I don’t know if I’ll really remember figures of dozens of machines, but hey: it’s just additional fun.

In case you want to make this behavior default, add „VisualHostKey yes“ to your „~/.ssh/config“. In case you don’t have this file, make a new one with the following content (and find out that this file makes ssh really poweful in combination with command line completion, but that is another topic):

Host *
	VisualHostKey		yes

Please note: This might break applications that rely on the ssh console client as they don’t expect graphical art popping up. So if some other clients don’t work anymore, play around with aliases or your ~/ssh/config file.

Thank you, OpenSSH guys, I really appreciate your work.

10 hints for having a nice time with an upgrade to Ubuntu Intrepid Ibex

A couple of months ago, just before the Hardy release, I posted some hints for having a smooth upgrade. As the Intrepid Ibex release is three weeks ahead and beta is flying around, I’d like to remember on the hints with some minor updates:

  1. Remove all applications you installed for testing purposes but don’t use them. It’s a nice feeling to have a mostly cleaned machine. Removing applications before an update reduces download time, the space needed and dependency calculations as well as the risk of a dependency failure. So just drop all those only once clicked applications, games and even libraries. Take some time for this, it will save you time later (downloading, unpacking, dependency management). Trust me.
  2. Check that you have enough space left on your device. Hundreds of packages are being downloaded in one step, therefore you should have enough disk space for this. Keep this in mind.
  3. Compiled software by your own? Installed external .deb-files? If possible: Uninstall them, you can later reinstall them if they are not provided by Ubuntu+1.
  4. Added software repositories to /etc/apt/sources.list (or Synaptec?). Disable them for now.
  5. Of course: Back up, back up, back up. Decide, if a backup of your home directory fits your needs or you also want the rest of your partitions.
  6. Bring enough time: A full upgrade might take two hours and more, depending on your ram, cpu power, network speed and amount of installed applications. Don’t think an upgrade runs automatically – it will ask you several questions during package upgrades and therefore awaits your attention. Make the day your upgrade day or at least the afternoon your upgrade afternoon. A cup of tea might help.
  7. Check for already known caveats that you might take care of. Normally the most important ones are collected on the wiki page to the current beta release like this one. Really do this! There has just been a severe bug in the alpha release that could even damage hardware. So reading this can save you a lot of time.
  8. Make yourself clear what „alpha“ an „beta“ mean: Take them as warnings and only take the risk of an upgrade if you are not under time pressure for a project (like writing an essay, developing an application or anything with a deadline close to your upgrade day)… and don’t moan when something doesn’t work. You are going to use free software in a testing period. It is probably your bug report that improves it.
  9. Check if you have the possibility to have a second computer around enabling you for checking against discussion boards, wikis and other ressources of useful information. In case of an emergency it is crucial to be online in way because often really simple tricks can save your day.
  10. If you are going to install more than one system, try setting up an apt-cache, apt-proxy or similar which will save you a lot of download time.

After these steps, feel free to give „update-manager -d“ a try. Take notes of things that look strange and check launchpad bug tracker if they are already reported. Now it is up to you to help making Ubuntu a better distribution and Intrepid a really success.

[update]

There is a Spanish translation of this blog entry on UbuntuWay. Thank you.

My (unofficial) package of the day: 3ware-cli and 3dms for monitoring 3ware raid controllers

Having a real hardware raid controller is a nice thing: Especially in a server setup it helps you keeping data safe on multiple disks. Though, a common mistake is, having a raid controller and not monitoring it. Why? Let’s say, you have a simple type 1 array (one disk mirrored to another) and one of the disks fails. If your raid systems works it will continue to work. But if you did not setup a monitoring for it, you won’t notice it and the chance of a total data loss increases as you are running on one disk now.

So monitoring a raid is actually the step that makes your raid system as safe as you wanted it when setting it up. Some raids are quite easy to monitor, like a Linux software raid system. Some need special software. As I recently got a bunch of dedicated (Hetzner DS8000 and other) servers with 3ware raid controllers, I checked the common software repositories for monitoring software and was surprised not finding any suitable. So a web research showed me that there are Linux tools from 3ware. Of course they don’t provide .deb packages so you need to take of this yourself if you don’t want to install the software manually.

But there exists an unofficial Debian repository by Jonas Genannt (thank you!), providing recent packages of 3ware utilities under http://jonas.genannt.name/. Check the repository, it offers 3ware-3dms and 3ware-cli. 3ware-3dms is a web application for managing your raid controller via browser, BUT: think twice, if you want this. The application opens a privileged port (888) as it is not able to bind on the local interface and has a crappy user identification system. As I am not a friend of opening ports and closing them afterwards via firewall I dropped the web solution.

The „3ware-cli“ utility is just a command line interface to 3ware controllers. Just grab a .deb from the repository above and install it via „dpkg -i xxx.deb“. Aftwerwards you stark asking your controller questions about it’s status. The command is called „tw_cli“, so let’s give it a try with „info“ as parameter:

# tw_cli info
Ctl   Model        (V)Ports  Drives   Units   NotOpt  RRate   VRate  BBU
------------------------------------------------------------------------
c0    8006-2LP     2         2        1       0       2       -      -

tw_cli told us, that there is one controller (meaning a real piece of raid hardware) called „c0“ with two drives. No we want more detailed information about the given controller:

# tw_cli info c0
 
Unit  UnitType  Status         %RCmpl  %V/I/M  Stripe  Size(GB)  Cache  AVrfy
------------------------------------------------------------------------------
u0    RAID-1    OK             -       -       -       232.885   ON     -      
 
Port   Status           Unit   Size        Blocks        Serial
---------------------------------------------------------------
p0     OK               u0     232.88 GB   488397168     6RYBP4R9
p1     OK               u0     232.88 GB   488397168     6RYBSHJC

tw_cli reports that controller c0 has one unit „u0“. A unit is the device that your operating system is working with – the „virtual“ raid drive provided by the raid controller. There are two ports/drives in this unit, called „p0“ and „p1“. Both of them have „OK“ as status message meaning that the drives are running fine.

You also ask a drive directly by asking tw_cli for the port on the controller:

# tw_cli info c0 p0

Port   Status           Unit   Size        Blocks        Serial
---------------------------------------------------------------
p0     OK               u0     232.88 GB   488397168     6RYBP4R9            

# tw_cli info c0 p1

Port   Status           Unit   Size        Blocks        Serial
---------------------------------------------------------------
p1     OK               u0     232.88 GB   488397168     6RYBSHJC

So you might already got the clue: As tw_cli is just a command line tool your task for an automated setup is setting up a cronjob checking the status of the ports (not the unit! the ports – trust me) regularly and sending a mail or nagios alarm when necessary. I just started writing a little shell script which, right now, just returns an exit status – 0 for a working raid and 1 for a problem:

#!/bin/bash
 
UNIT=u0
CONTROLLER=c0
PORTS=( p0 p1 )
 
tw_check() {
  local regex=${1:-${UNIT}}
  local field=3
  if [ $# -gt 0 ]; then
    field=2
  fi
  local check=$(tw_cli info ${CONTROLLER} $1 \
    | awk "/^$regex/ { print \${field} }")
  [ "XOK" = "X${check}" ]
  return $?
}
 
tw_check || exit 1
for PORT in ${PORTS[@]}; do
tw_check ${PORT} || exit 1
done

As you see you can configure unit, controller and ports. I have not checked this against systems with multiple controllers and units as I don’t have such a setup. But if you need you could just put the configuration stuff in a sourced configuration file.

After writing this little summary I checked all servers I am responsible of and noticed that nearly every server with hardware raid has a 3ware controller and can be checked with tw_cli. Fine…

Let me know how you manage your 3ware raid monitoring under GNU/Linux and Debian/Ubuntu based systems.

my package of the day – htmldoc – for converting html to pdf on the fly

PDF creation got actually fairly easy. OpenOffice.org, the Cups printing system, KDE provide methods for easily printing nearly everything to a PDF file right away. A feature that even outperforms most Windows setups today. But there are still PDF related task that are not that simple. One I often run into is automated PDF creation on a web server. Let’s say you write a web application and want to create PDF invoices on the fly.

There are, of course, PDF frameworks available. Let’s take PHP as an example: If you want to create a PDF from a php script, you can choose between FPDF, Dompdf, the sophisticated Zend Framework and more (and commercial solutions). But to be honest, they are all either complicated (as you often have to use a specific syntax) to use or just quite limited in their possibilities to create a pdf file (as you can only use few design features). As I needed a simple solution for creating a 50+ pages pdf file with a huge table on the fly I tested most frameworks and failed with most of them (often just as I did not have enough time to write dozens of line of code).

So I hoped to find a solution that allowed me just to convert a simple HTML file to a PDF file on the fly providing better compatibility than Dompdf for instance. The solution was … uncommon. It was no PHP class but a neat command line tool called „htmldoc“ available as a package. If you want to give it a try just install it by calling „aptitude install htmldoc“.

You can test htmldoc by saving some html files to disk and call „htmldoc –webpage filename.html“. There a lot of interesting features like setting font size, font type, the footer, color and greyscale mode and so on. But let’s use htmldoc from PHP right away. The following very simple script uses the PHP output buffer for minimizing the need for a write to disk to one file only (if somebody knows a way of using this without any temporary files from a script, let me know):

// start output buffer for pdf capture
 
ob_start();
?>
your normal html output will be places here either by
dumping html directly or by using normal php code
<?php
// save output buffer
$html=ob_get_contents();
// delete Output-Buffer
ob_end_clean();
// write the html to a file
$filename = './tmp.html';
if (!$handle = fopen($filename, 'w')) {
	print "Could not open $filename";
	exit;
}
if (!fwrite($handle, $html)) {
	print "Could not write $filename";
	exit;
}
fclose($handle);
// htmldoc call
$passthru = 'htmldoc --quiet --gray --textfont helvetica \
--bodyfont helvetica --logoimage banner.png --headfootsize 10 \
--footer D/l --fontsize 9 --size 297x210mm -t pdf14 \
--webpage '.$filename;
 
// write output of htmldoc to clean output buffer
ob_start();
passthru($passthru);
$pdf=ob_get_contents();
ob_end_clean();
 
// deliver pdf file as download
header("Content-type: application/pdf");
header("Content-Disposition: attachment; filename=test.pdf");
header('Content-length: ' . strlen($pdf));
echo $pdf;

As you can see, this is neither rocket science nor magic. Just a wrapper for htmldoc enabling you to forget about the pdf when writing the actual content of the html file. You’ll have to check how htmldoc handles your html code. You should make it as simple as possible, forget about advanced css or nested tables. But it’s actually enough for a really neat pdf file and it’s fast: The creating of 50+ page pdf files is fast enough in my case to make the on demand access of htmldoc feel like static file usage.

Please note: Calling external programs and command line tools from a web script is always a security issue and you should carefully check input and updates for the program you are using. The code provided should be easily ported to another web language/framework like Perl and Rails.

first „my package of the day“ republished on debaday

Just for your information as some people moaned about my „my package of the day“ series: A first article about „file“ has been republished there, more will follow and I am really happy contributing to this project. But let me add that I will continue introducing you right here to some of my favorite software packages as there are three major reasons:

  1. Some packages already have been described on debaday and therefore won’t be pushed a second time. As times change and people focus on different features when talking about software I see no problem in repeating package description with other words and even images.
  2. The debaday team tries to distribute the articles they get as good as possible. This means that between publication there can be a gap of some days. As you might understand, when writing a blog article you are most times yearning for hitting the „publish“ button and see what the crowd says.
  3. The republication on debaday shows, that a cooperations works really fine and there is no need to bother around.

So, thank you guys for reading and commenting and thank you, debaday team, for the wonderful work.

my package of the day – htop as an alternative top

„top“ is one of those programs, that are used quite often but actually nobody talks about. It just does its job: showing statistics about memory, cache and cpu consumption, listing processes and so on. Actually top provides you some more features like batch mode and the ability to kill processes, but it’s all quite low level – e.g. you have to type the process id (pid) of process you want to kill.

So, though an applications like top makes sense on the console, a more sophisticated one would be great, extending the basic top functionality with enhancements to it’s usage. This tool already exists: It’s the ncurses based „htop“ and we’ll have a closer look at it now.

For the beginning: Install „htop“ by running „aptitude install htop“, Synaptic or the package manager of your choice. As you can see, htop is quite colorful, which is, of course, a matter of taste. In my opinion, colors make sense, when the they mean something or provide better readability. So let’s check the output in brief:

htop1.png

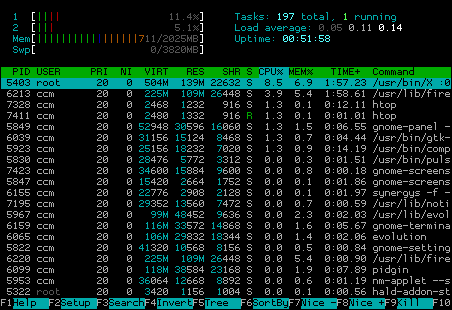
At the upper left corner you see statistics about the usage of cpu cores (in my case there are two of them, marked „1“ and „2“), memory and swap statistics, while on the right side, you have the common uptime/load stats. The interesting part is the usage of colors in cpu/ram/swap bars. If you are new to htop you have to look the colors up at least once. Therefore just stroke „h“ („F1“ should work, too, but Gnome might get in your way) and you’ll see a nice explanation in the help:

htop2.png

Quite interesting is the distribution between green and red in the cpu stats, as a high kernel load often means something goes wrong (with the hardware i/o for instance). In the memory bar the real used ram is marked green – blue and orance actually could be cleared by the kernel if necessary. (People are often confused that their ram seems to be full, when calling a tool like/htop though they are not running that many programs. It’s important to understand, that the memory is also used for buffering/caching and that this memory can often be used by „real“ data later on).

So what’s the next htop feature? Use your mouse, if you like! You can test it by clicking on „Help“ on the menu bar at the bottom. Maybe while clicking around a bit you already noticed that you can also click on processes and mark them. What for? Well, htop enables you to kill processes quit easy, as you don’t have to type a process id, write a pattern or something, you just can mark them with a mouse or cursor and either click on „Kill“ in the menu or stroke the „F9“ or „k“ key. „htop“ will let you choose from a list of signals afterwards:

htop3.png

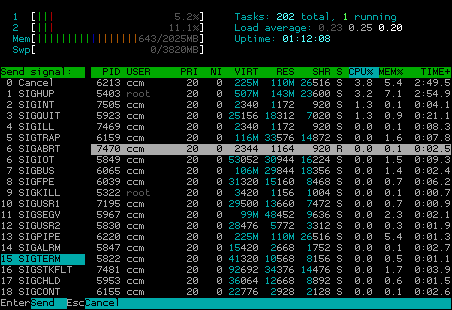
Of course you cannot kill processes that belong to your user when htop does not run as root (i.e. with „sudo“). „htop“ marks processes that belong to user it is run by with a brighter process id:

htop4.png

Sadfully this also means, that running htop as root/sudo, marks processes that belong to non-root with a darker grey. But hey, that’s a nice missing feature for patch, isn’t it?

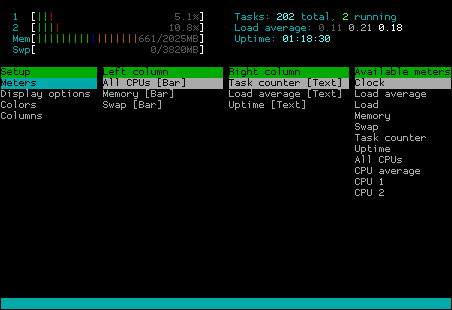
If you like to become an advanced htop user, you can check the „Setup“ menu (click it or press the „F2“ or „S“ key). You will see a menu for configuring the output of htop, enabling you to switch off and on the display of certain information:

htop5.png

Of course you can also sort the process list (click „Sort“ or press „F6“) which give you a list of possible sort parameters:

htop6.png

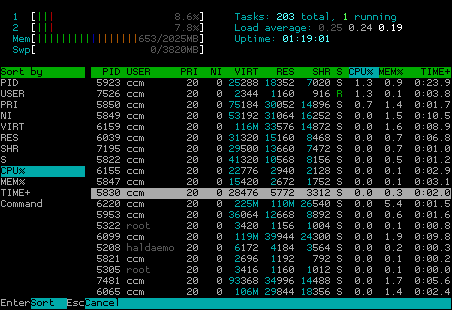
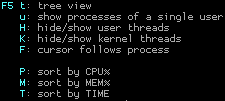
In spite of this, you can switch to a process tree display and sort it by pressing one of the keys showed below:

htop7.png

So let me give you a last nice gimmick and then end for today: You can try to attach „strace“ to a running process by marking the process typing „s“. If you don’t know, what strace is, don’t bother, if you do, you will probably like this feature pretty much.

I hope you got the clue about using htop, which is a really neat, full featured console top replacement that is even worth to be used when running X as it supports mouse usage and brings everything you need while still having a small footprint. If you have alternatives, you like mention, feel free to drop them as a comment.

my package of the day – mtr as a powerful and default alternative to traceroute

Know the situation? Something is wrong with the network or you are just curious and want to run a „traceroute“. At least under most Debian based systems your first session will probably look like this:

$ traceroute www.ubuntu.com
command not found: traceroute

Maybe on Ubuntu you will at least be hinted to install „traceroute“ or „traceroute-nanog“… To be honest, I really hate this lack of a basic tool and cannot even remember how often I typed „aptitude install traceroute“ afterwards (and press thumbs your network is up and running).

But sometimes you just need to dig a bit deeper and this time the surprise was really big as the incredible Mnemonikk told me about an alternative that is installed by default in Ubuntu and nearly no one knows about it: „mtr„, which is an abbreviation for „my traceroute“.

Let’s just check it by calling „mtr www.ubuntu.com“ (i slightly changed the output for security reasons):

                 My traceroute  [v0.72]
ccm        (0.0.0.0)          Wed Jun 20 6:51:20 2008
Keys:  Help   Display mode   Restart statistics   Order
of fields      Packets               Pings
 Host        Loss%   Snt   Last   Avg  Best  Wrst StDev
 1. 1.2.3.4   0.0%   331    0.3   0.3   0.3   0.5   0.0
 2. 2.3.4.5   0.0%   331   15.6  16.3  14.9  42.6   2.6
 3. 3.4.5.6   0.0%   330   15.0  15.5  14.4  58.5   2.7
 4. 4.5.6.7   0.0%   330   17.5  17.3  15.4  60.5   5.3
 5. 5.6.7.8   0.0%   330   15.7  24.3  15.6 212.3  30.2
 6. ae-32-52 58.8%   330   20.6  22.1  15.9  42.5   4.7
 7. ae-2.ebr 54.1%   330   20.6  25.0  19.0  45.4   4.7
 8. ae-1-100  0.0%   330   21.5  25.4  19.2  41.1   5.1
 9. ae-2.ebr  0.0%   330   27.5  34.0  26.7  73.5   5.2
10. ae-1-100  0.3%   330   28.8  33.6  26.7  72.5   6.0
11. ae-2.ebr  0.0%   330   30.8  32.9  26.7  48.5   5.0
12. ae-26-52  0.0%   330   27.6  34.8  26.9 226.8  26.8
13. 195.50.1  0.3%   330   27.7  28.4  27.2  42.5   1.7
14. gw0-0-gr  0.0%   330   27.9  28.1  27.0  40.5   1.4
15. avocado.  0.0%   330   27.8  28.0  27.2  36.2   1.0

You might notice, that the output is quite well formed („mtr“ uses curses for this). The interesting point is: Instead of running once, mtr continuously updates the output and statistics, providing you with a neat network overview. So you can use it as an enhanced ping showing all steps between you and the target.

For the sake of it: The package installed by default in Ubuntu is actually called „mtr-tiny“ as it lacks a graphical user interface. If you prefer a gui you can replace the package with „mtr“ by running „aptitude install mtr“. When running „mtr“ from the console afterwards you will be prompted with a gtk interface. In case you still want text mode, just append „–curses“ as a parameter.

Yes, that was a quick package, but if you keep it in mind, you will save time, you normalle spend for installing „traceroute“ and you’ll definitely have better results for network diagnose. Happy mtr’ing!

[update]

sherman noted, that the reason for traceroute not being installed is, that it’s just deprecated and „tracepath“ should be used instead. Thank you for the hint, though I’d prefer „mtr“ as it’s much more reliable and verbose.

my package of the day – gpg for symmetric encryption

Though asymmetric encryption is state of the art today, there are still cases when you probably are in need of a simple symmetric encryption. In my case, I need an easy scriptable interface for encrypting files for backup as transparent as possible. While you can, of course, use asymmetric encryption for this, symmetric methods can save you a lot of time while still being secure enough.

So there are methods like stupid .zip encryption or a bunch of packages in the repositories like „bcrypt“ that provide you with their implementations. But there is a tool, you already know and maybe even use, but don’t think of when considering symmetric encryption: „gpg„. Actually gpg heavily relies on symmetric algorithms as you might know. The public/private key encryption is a combination of asymmetric and symmetric encryption as the latter is quite more cpu efficient. In our case, gpg will use the strong cast5 cipher by default.

Encrypting

So as gpg already knows about a bunch of symmetric encryption algorithms, why not use them? Let’s just see an example. You have a file named „secretfile1.txt“ and want to encrypt it:

$ gpg --symmetric secretfile1.txt

You will be prompted for a password. Afterwards you’ll have a file named secretfile1.txt.gpg. You are already done! Please note: The file size of the encrypted file might have decreased as gpg also compresses during encryption and outputs a binary. In my test case the file size went down from 700k to 100k. Nice.

Armoring

In case you need to have an easy portable file that is even ready to be copy-pasted, you can ask gpg to create an ascii armor container:

$ gpg --armor --symmetric secretfile1.txt

The output file will be called „secretfile1.txt.asc“. Don’t bother to open it in a text editor of your choice. The beginning will look similar to this:

$ head secretfile1.txt.asc
-----BEGIN PGP MESSAGE-----
Version: GnuPG v1.4.6 (GNU/Linux)

jA0EAwMChpQrAA/o8IFgye1j3ErZPvXumcnIwbzSvENDD/fYlWMRiY/qqvn949kV
+mo/v+nQi7OFrrA45scQPuPbj8I1T+2f7XAT4ouW2kuHIJ/2zkyrxBMvO04fDH82
273NwUrXd/s+JJXe+wJz149K324rE7+FIHvfImiez8lRs5qyRI/drp/wFK8ZHRvF
gzhDGaTe8Dgj1YqHgWAY4eAjrXhYLI1imbIYrV1OVPia6Roif37FV7C1AT/i/2HX
2ytI2mBhQLdqkSVeqXZ74lgZhsitnOeqZH65IuTLi77PUcroFOuefw6+4qSpMIuM
8dyi4jCqQ1jCR7PRorpGvm3RtXhlkB689vrknKmOa5uztTj3MGrPOgC6jegBpu/L
3419sAxRtw8bj2lP76B+XXPZ2Tuzpg01hC/BWlifSexy+juYXv7iuF5BuQ1z7nTi

(In this case I used ‚head“ for displaying the first ten lines. Head is similar to tail, which you might already know.) Though the ascii file is larger than the binary .gpg file it is still much smaller than the original text file (about 200k in the above case). When tampering with binary files like already compressed tarballs the file size of the encrypted file might slightly increase. In my test, the size grew from a 478kB file to a 479kB file when using binary mode. In ascii armor mode the size nearly hit the 650kb mark, which is still pretty acceptable.

Decrypting

Decrypting is as easy. Just call „gpg –decrypt“, for instance:

$ gpg --decrypt secretfile1.txt.gpg
# or
$ gpg --decrypt secretfile1.txt.asc

gpg knows by itself, if it is given an ascii armored or binary file. But nevertheless the output will be written to standard output, so the following line might be much more helpful for you:

$ gpg --output secretfile1.txt --decrypt secretfile1.txt.gpg

Please note, that you need to stick to the order first –output, then –decrypt. Of course you can also use a redirector („>“).

Piping

So, for the sake of it: The real interesting thing is that you can use gpg symmetric encryption in a chain of programs, controlled by pipes. This enables you to encrypt/decrypt on the fly with shell scripts helping you to write strong backup scripts. Gpg already detects, if your are using it in a pipe. So let’s try it out:

$ tar c directory | gpg --symmetric --passphrase secretmantra \
| ssh hostname "cat &gt; backup.tar.gpg"

We just made a tarbal, encrypted it and sent it over ssh without creating temporary files. Nice, isn’t it? To be honest, piping over ssh is not a big deal anymore. But piping to ftp? Check this:

$  tar c directory | gpg --symmetric --passphrase SECRETMANTRA \
| curl --netrc-optional --silent --show-error --upload-file - \
--ftp-create-dirs ftp://USER:PASSWORD@SECRETHOST/SECRETFILE.tar.gpg

With the mighty curl we just piped from tar over gpg directly to a file on a ftp server without any temporary files. You might get a clue of the power of this chain. Now you can start using a dumb ftp server as encrypted backup device now completely transparently.

That’s all for now. If you like encryption, you should also check symmetric encryption and the possibilities of enhancing daily business scripts security by adding some strong crypto to it. Of course you can complain about the security of the password, the possible visibility via „ps aux“, but you should be able to reduce risks by putting some brain in it. In the meantime check „bashup„, the bash backup script, which uses methods described here to provide you with a powerful and scriptable backup library written in Bash with minimum depencies. And yes, gpg will be added soon.