Howto setup a KVM server the fast way

This is a very short quick setup on how to get KVM server up and running. It assumes that

  • you want to run a KVM server with at least one virtual machine,
  • your KVM server gets an ip address in your network,
  • your virtual machine(s) get an ip address from your network – so you can use bridging instead of natting (using NATting instead of bridging is an easy task but not part of this howto),
  • you can use lvm for disk space allocation on your KVM master (using other disk space allications methods like image files is easy, too, but not part of this howto)

Get the server running

I assume you are able to install an Ubuntu server from scratch and setup a lvm environment. Actually this can be done by mostly accepting the defaults during the Ubuntu server setup. I’d suggest you install at least Ubuntu Lucid 10.04 or newer.
If you continue reading here, you should have a running, up-to-date Ubuntu server with network connectivity and preferably access via ssh.

Get the network up and running

For the bridged network you need to install the bridge utilities and change your network configuration. First install the package:
$ sudo apt-get install bridge-utils
Now add a bridge named „br0“ (this has only be done once):
$ sudo brctl addbr br0
Now change your /etc/network/interfaces so it uses the bridge br0. This step actually sets up br0 instead of eth0. Think of eth0 as being just a physical transport added to the virtual bridge interface.
# The loopback network interface
auto lo
iface lo inet loopback
 
auto eth0
iface eth0 inet manual
 
auto br0
iface br0 inet static
address 192.168.1.100
netmask 255.255.255.0
network 192.168.1.0
broadcast 192.168.1.255
gateway 192.168.1.1
bridge_ports eth0
bridge_fd 9
bridge_hello 2
bridge_maxage 12
bridge_stp off

Please make sure you don’t forget setting your „eth0“ to „iface eth0 inet manual“ as shown above. This is needed as you want to prevent eth0 to fetch an address via dhcp but still want it to be there for your bridge as it is the physical layer. After you setup the bridge either restart your network (sudo /etc/init.d/networking restart) or reboot your server. If you are accessing your server already by ssh be warned that a misconfiguration might lock you out.

Install KVM

Now it’s time to install kvm and some usefull helper applications:
$ sudo apt-get install qemu-kvm ubuntu-vm-builder uml-utilities \
  virtinst

That’s all: You already have a kvm server now. Time to…

Install your first virtual machine

We are going to setup a 100Gb logical volume for the guest, download Ubuntu and create a machine with 2Gb of Ram and 4 cores:

# create an empty 100Gb logical volume
sudo lvcreate --size 100G vg0 --name guest1
# download Ubuntu iso
$ wget http://..../
# create machine
$ sudo virt-install --connect qemu:///system -n guest1 -r 2048 \
 --vcpus=4 -f /dev/mapper/guest1 --network=bridge:br0 \
 --vnc --accelerate -v -c ./SOMEUBUNTUISO.iso \
 --os-type=linux --os-variant=ubuntuKarmic --noautoconsole
# please note: "ubuntuKarmic" is currently the most recent
# virt-install defaults scheme - just use this if in doubt.

Get a VNC connection

KVM uses VNC to give you ca graphical interface to your machine. The good thing about this is, that it enables you to use graphical installers (and yes, even Windows) without problems. As even Ubuntu server boots into a graphical mode in the beginning – it’s great to use VNC here.

I assume you are working on a remote server. KVM gives every guest it launches a new vnc instance with a new, incremented port. It starts with 5900. So let’s tunnel via ssh:

ssh user@remotekvmhost -L 5900:localhost:5900

You connect to your remote kvm host via ssh and open a ssh tunnel fort port 5900. Now start your prefered VNC client locally and let it connect to either display „0“ or port 5900 which means the same in VNC (duh…).

From now on you should see your server on a VNC display. Install it like you’d install every other server. The networking is bridged, so you could even use dhcp if that is offered in your network.

Please make sure, you install the package „acpi“ inside your kvm guest, otherwise you won’t be able to stop the guest from the master (as it is done via acpi):

# make sure, "acpi" is installed in the *guest* machine
sudo apt-get install acpi

After installation you can manage your kvm gues by using the following commands:

# list running instances
$ virsh list
# start an instance
$ virsh start INSTANCENAME
# stop an instance politely
$ virsh stop INSTANCE
# immediatly destroy a running instance
$ virsh destroy INSTANCE
# edit the config file for an instance
$ virsh edit INSTANCE

Mounting the LVM volumes

As you might have noticed, your virtual guest’s lvm volumes cannot be mounted directly in the master as they contain their own partition table. If you need access to the guest’s filesystem from the master, though, you have to create some device nodes. There is a great tool called „kpartx“ than can create and delete device nodes for you. It’s as easy as this:

# install kpartx
$ sudo install kpartx
# make sure, virtual gues is switched off!
# create device nodes
$ sudo kpartx -a /dev/mapper/guest1
# check /dev/mapper for new device nodes and mount/unmount them
# after you are done, delete the nodes
$ sudo kpartx -d /dev/mapper/guest1

Please note, this methods also works with other block devices like image files containing partition tables. You only might run into trouble, when your lvm volume contains it’s own lvm. If that is the case, play around with pvscan, vgscan and lvscan after using kpartx. Be brave but be warned that backing up data is always a great idea.

Alternative Management Interfaces

In case you really need a gui for your management needs, check „virt-manager“. You can install this on your desktop and remotely manage running instances:

$ sudo install virt-manager

You should check RedHat’s „Virtual Machine Manager“ page, though. It might be a good idea to manually compile and install a more recent version and rely on the setup howtos. Personally I prefer using plain text console here, as it helps being able to act quite fast and from everywhere when problems occur.

Conclusion

Nowadays it’s fairly easy setting up a KVM server. As KVM/libvirt enabled guests are quite fast, it’s a nice and easy way for even hosting virtual machines. I run about a dozen virtual machines and three hardware servers for two years now without any serious problems.

How to log history and logins from multiple ssh-keys under one user account

Many times your managed server has only one user account into wich every admin logs in with his personal ssh-key. Most times it’s done with the root account, but that’s a nother topic 😉 As a result of this behaviour your are not able to see who logged in and what he or she did. A often suggested solution would be using different user account per person with only one ssh-key for authorization. This adds the „overhead“ of memorizing (except when you use ~/.ssh/config) and managing the sudoers file for all the accounts.

A more clever way is to use the SSH Environment feature in your authorized_keys file. First you need to enable this feature within the /etc/sshd/sshd_config file:

PermitUserEnvironment yes

After that you can configure your ~/.ssh/authorized_keys file:

environment="SSH_USER=USER1" ssh-rsa AAAAfgds...
environment="SSH_USER=USER2" ssh-rsa AAAAukde..

This sets the SSH_USER variable on Login in reference to the used ssh-key. NOw that this variable is updated on every login you can go on and work with it. First of to the logging of the actuall key that logs in. Under normal circumstances the ssh-dameon logs only the following information

sshd[21169]: Accepted publickey for user_account from 127.0.0.1 port 46416 ssh2

Additinally you could pass the SSH_USER content on to the syslog-dameon to log the actual user:

if [ "$SSH_USER" != "" ]; then
  logger -ip auth.notice -t sshd "Accepted publickey for $SSH_USER"
fi

This writes the following into the /var/log/auth (Debian) or /var/log/messages (RedHat) file:

sshd[21205]: Accepted publickey for USER1

Further more you can change the bash history file to a personal user file:

  export HISTFILE="$HOME/.history_$SSH_USER"


All together it looks like this:

if [ "$SSH_USER" != "" ]; then
  logger -ip auth.notice -t sshd "Accepted publickey for $SSH_USER"
  export HISTFILE="$HOME/.history_$SSH_USER"
fi


Puppet
To use the environment option within your ssh-key management in puppet you need the options field from the ssh_authorized_key function:

ssh_authorized_key { "${username}":
 
  key     =>  "AAAAsdnvslibyLSBSDFbSIewe2131sadasd...",
  type    =>  "ssh-rsa,
  name    =>  "${username}",
  options =>  ["environment=\"SSH_USER=${username}\""],
  user    =>  $user,
  ensure  =>  "present",
}


Hope this helps, have fun! :)

p.s.: This is a guest post by Martin Mörner, a colleague from Aperto.

Recovering Linux file permissions

I recently ran into a server, where somebody accidently issued a „chown -R www-data:www-data /var“. So all files and directories within /var where chowned to the www-data which actually means a complete system fuckup as everything from logging over mail and caching to databases relies on a correct setup there. Sadfully this was a remote production server so I had to find a quick solution to get a least a state good enough for the next days.

I started peaking around a possibity to reset file permissions based on .deb package details. There are at least approaches (the method there misses a pre-download of all installed .deb packages) to do this (and I remember running a program years ago that checked file permissions based on .deb files – just did not find it via apt-get). Nonetheless this approach lacks the possibility of handling application created files. Files in /var/log for instance don’t have to be declared in a .deb file but urgently need the right file permissions.

So I came to a different approach: cloning permissions. By chance we had a quite similar server running meaning same Linux distribution and nearly the same services installed. I wrote a one liner to save the file permissions on the healthy server:

$ find /var -printf "%p;%u;%g;%m\n" > permissions.txt

The command writes a text file with the following format:

dir/filename;user;group;mode

Please note, I started using „:“ as a separator but noted that at least some Perl related files have a double colon in there name.

Now I only needed a simple shell script that sets the file permissions on the broken server based on the text file we just generated. It came down to this:

#!/bin/bash

ENTRIES=$(cat permissions.txt)

for ENTRY in ${ENTRIES}
do
	echo ${ENTRY} | sed "s/;/ /g" | {
		read FILE USER GROUP MODE
		chown ${USER}:${GROUP} "${FILE}"
		chmod ${MODE} "${FILE}"
	}
done

The script reads every line of the text file, splits it’s content into variables and sets the user and group via „chown“ as well as the mode via „chmod“. It doesn’t check if a directory/file exists before chowning/chmodding it, as it actually doesn’t matter. If it’s not there, it just won’t do something harmfull.

After you’ve run this, it’s a good idea to restart all services and start watching log files. You have to take care of all services that rely on fast changing files in /var. For instance a mail daemon puts a lot of unique file names into /var/spool and the script above won’t be able to take care of that. You have to double check database directories like /var/lib/mysql, hosted repositories and so on. But the script will provide with a state where most services are at least running and you get an idea of how to switch back the remaining directories. It might be helpfull to search for suspicious files, like

$ find /var -user www-data

Short talk on MariaDB at Linuxtag 2011

If you happen to be around at this years LinuxTag 2011 in Berlin/Germany, you are invited to attend my short talk on MariaDB as a drop-in replacement for MySQL. The talk focusses on differences between MySQL Community Edition and MariaDB (e.g. XtraDB, Aria, userstats), shows some features live and explains how to switch. I’ll probably post the slides here afterwards.

The talk will be held in German and is scheduled for Friday, the 13th of May, 16:30. The official announcement can be found here.

A quick note on MySQL troubleshooting and MySQL replication

PLEASE NOTE: I am currently reviewing and extending this document.

While caring for a remarkable amount of MySQL server instances, troubleshooting becomes a common task. It might of interest for you which

Recovering a crashed MySQL server

After a server crash (meaning the system itself or just the MySQL daemon) corrupted table files are quite common. You’ll see this when checking the /var/log/syslog, as the MySQL daemon checks tables during its startup.

Apr 17 13:54:44 live1 mysqld[2613]: 090417 13:54:44 [ERROR]
  /usr/sbin/mysqld: Table './database1/table1' is marked as
  crashed and should be repaired

The MySQL daemon just told you that it found a broken MyISAM table. Now it’s up to you fixing it. You might already know, that there is the „REPAIR“ statement. So a lot of people enter their PhpMyAdmin afterwards, select database and table(s) and run the REPAIR statements. The problem with this is that in most cases your system is already in production – for instance is up again and the MySQL server already serves a bunch of requests. Therefore a REPAIR request gets slowed down dramatically. Consider taking your website down for the REPAIR – it will be faster and it’s definitely smarter not to deliver web pages based on corrupted tables.

The other disadvantage of the above method is, that you probably just shut down your web server and your PhpMyAdmin is down either or you have dozens of databases and tables and therefore it’s just a hard task to cycle through them. The better choice is the command line in this case.

If you only have a small number of corrupted tables, you can use the „mysql“ client utility doing something like:

$ mysql -u root -p
Enter password:
Welcome to the MySQL monitor.  Commands end with ; or \g.
Your MySQL connection id is 10
Server version: 5.0.75-0ubuntu10 (Ubuntu)

Type 'help;' or '\h' for help. Type '\c' to clear the buffer.

mysql> REPAIR TABLE database1.table1;
+--------------------+--------+----------+----------+
| Table              | Op     | Msg_type | Msg_text |
+--------------------+--------+----------+----------+
| database1.table1   | repair | status   | OK       |
+--------------------+--------+----------+----------+
1 row in set (2.10 sec)

This works, but there is a better way: First, using OPTIMIZE in combination with REPAIR is suggested and there is a command line tool only for REPAIR jobs. Consider this call:

$ mysqlcheck -u root -p --auto-repair --check --optimize database1
Enter password:
database1.table1      OK
database1.table2      Table is already up to date

As you see, MySQL just checked the whole database and tried to repair and optimize it.

The great deal about using „mysqlcheck“ is, that it can also be run against all databases in one run without the need of getting a list of them in advance:

$ mysqlcheck -u root -p --auto-repair --check --optimize \
  --all-databases

Of course you need to consider if an optimize of all your databases and tables might just take too long if you have huge tables. On the other hand a complete run prevents of thinking about a probably missed table.

[update]

nobse pointed out in the comments, that it’s worth having a look at the automatic MyIsam repair options in MySQL. So have a look at them if you want to automate recovery:

option_mysqld_myisam-recover

Recovering a broken replication

MySQL replication is an easy method of load balancing database queries to multiple servers or just continuously backing up data. Though it is not hard to setup, troubleshooting it might be a hard task. A common reason for a broken replication is a server crash – the replication partner notices that there are broken queries – or even worse: the MySQL slave just guesses there is an error though there is none. I just ran into the latter one as a developer executed a „DROP VIEW“ on a non-existing VIEW on the master. The master justs returns an error and ignores. But as this query got replicated to the MySQL SLAVE, the slave thinks it cannot enroll a query and immediately stopped replication. This is just an example of a possible error (and a hint on using „IF EXISTS“ as often as possible).

Actually all you want to do now, is telling the slave to ignore just one query. All you need to do for this is stopping the slave, telling it to skip one query and starting the slave again:

$ mysql -u root -p
mysql> STOP SLAVE;
mysql> SET GLOBAL SQL_SLAVE_SKIP_COUNTER = 1;
mysql> START SLAVE;

That’s all about this.

Recreating databases and tables the right way

In the next topic you’ll recreate databases. A common mistake when dropping and recreating tables and databases is forgetting about all the settings it had – especially charsets which can run you into trouble later on („Why do all these umlauts show up scrambled?“). The best way of recreating tables and databases or creating them on other systems therefore is using the „SHOW CREATE“ statement. You can use „SHOW CREATE DATABASE database1“ or „SHOW CREATE TABLE database1.table1“ providing you with a CREATE statement with all current settings applied.

mysql> show create database database1;
+-----------+--------------------------------------------------------------------+
| Database  | Create Database                                                    |
+-----------+--------------------------------------------------------------------+
| database1 | CREATE DATABASE `database1` /*!40100 DEFAULT CHARACTER SET utf8 */ |
+-----------+--------------------------------------------------------------------+
1 row in set (0.00 sec)

The important part in this case is the „comment“ after the actual create statement. It is executed only on compatible MySQL server versions and makes sure, your are running utf8 on the database.

Keep this in mind and it might save you a lot of trouble.

Fixing replication when master binlog is broken

When your MySQL master crashes there is a slight chance that your master binlog gets corrupted. This means that the slaves won’t receive updates anymore stating:

[ERROR] Slave: Could not parse relay log event entry. The possible reasons are: the master’s binary log is corrupted (you can check this by running ‚mysqlbinlog‘ on the binary log), the slave’s relay log is corrupted (you can check this by running ‚mysqlbinlog‘ on the relay log), a network problem, or a bug in the master’s or slave’s MySQL code. If you want to check the master’s binary log or slave’s relay log, you will be able to know their names by issuing ‚SHOW SLAVE STATUS‘ on this slave. Error_code: 0

You might have luck when only the slave’s relay log is corrupted as you can fix this with the steps mentioned above. But a corrupted binlog on the master might not be fixable though the databases itself can be fixed. Depending on your time you try to use the „SQL_SLAVE_SKIP_COUNTER“ from above but actually the only way is to setup

Setting up replication from scratch

There are circumstances forcing you to start replication from scratch. For instance you have a server going live for the first time and actually all those test imports don’t need to be replicated to the slave anymore as this might last hours. My quick note for this (consider backing up your master database before!)

slave: STOP SLAVE;
slave: RESET SLAVE;
slave: SHOW CREATE DATABASE datenbank;
slave: DROP DATABASE datenbank;
slave: CREATE DATABASE datenbank;

master: DROP DATABASE datenbak;
master: SHOW CREATE DATABASE datenbank;
master: CREATE DATABASE datenbank;
master: RESET MASTER

slave: CHANGE MASTER TO MASTER_USER="slave-user", \
MASTER_PASSWORD="slave-password", MASTER_HOST="master.host";
slave: START SLAVE

You just started replication from scratch, check „SHOW SLAVE STATUS“ on the slave and „SHOW MASTER STATUS“ on the master.

Deleting unneeded binlog files

Replication needs binlog files – a mysql file format for storing database changes in a binary format. Sometimes it is hard to decide how many of the binlog files you want to keep on the server possibly getting you into disk space trouble. Therefore deleting binlog files that have already been transferred to the client might be a smart idea when running low on space.

First you need to know which binlog files the slave already fetched. You can do this by having a look on „SHOW SLAVE STATUS;“ on the slave. Now log into the MySQL master and run something like:

mysql> PURGE BINARY LOGS TO 'mysql-bin.010';

You can even do this on a date format level:

mysql> PURGE BINARY LOGS BEFORE '2008-04-02 22:46:26';

Conclusion

The above hints might save you same time when recovering or troubleshooting a MySQL server. Please note, that these are hints and you have – at any time – make sure, that your data has an up to date backup. Nothing will help you more.

my package of the day – htop as an alternative top

„top“ is one of those programs, that are used quite often but actually nobody talks about. It just does its job: showing statistics about memory, cache and cpu consumption, listing processes and so on. Actually top provides you some more features like batch mode and the ability to kill processes, but it’s all quite low level – e.g. you have to type the process id (pid) of process you want to kill.

So, though an applications like top makes sense on the console, a more sophisticated one would be great, extending the basic top functionality with enhancements to it’s usage. This tool already exists: It’s the ncurses based „htop“ and we’ll have a closer look at it now.

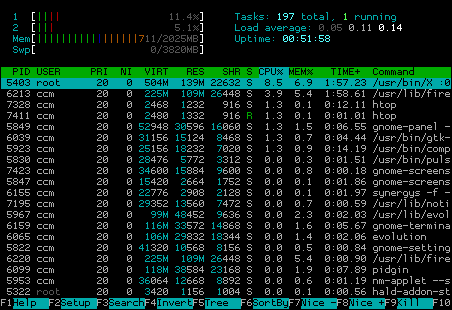
For the beginning: Install „htop“ by running „aptitude install htop“, Synaptic or the package manager of your choice. As you can see, htop is quite colorful, which is, of course, a matter of taste. In my opinion, colors make sense, when the they mean something or provide better readability. So let’s check the output in brief:

htop1.png

At the upper left corner you see statistics about the usage of cpu cores (in my case there are two of them, marked „1“ and „2“), memory and swap statistics, while on the right side, you have the common uptime/load stats. The interesting part is the usage of colors in cpu/ram/swap bars. If you are new to htop you have to look the colors up at least once. Therefore just stroke „h“ („F1“ should work, too, but Gnome might get in your way) and you’ll see a nice explanation in the help:

htop2.png

Quite interesting is the distribution between green and red in the cpu stats, as a high kernel load often means something goes wrong (with the hardware i/o for instance). In the memory bar the real used ram is marked green – blue and orance actually could be cleared by the kernel if necessary. (People are often confused that their ram seems to be full, when calling a tool like/htop though they are not running that many programs. It’s important to understand, that the memory is also used for buffering/caching and that this memory can often be used by „real“ data later on).

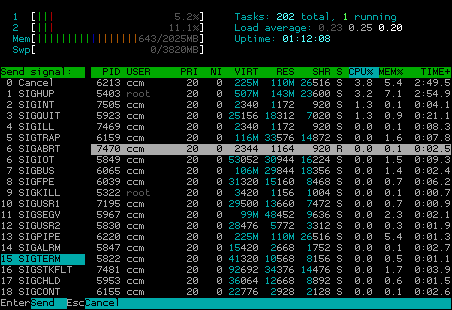
So what’s the next htop feature? Use your mouse, if you like! You can test it by clicking on „Help“ on the menu bar at the bottom. Maybe while clicking around a bit you already noticed that you can also click on processes and mark them. What for? Well, htop enables you to kill processes quit easy, as you don’t have to type a process id, write a pattern or something, you just can mark them with a mouse or cursor and either click on „Kill“ in the menu or stroke the „F9“ or „k“ key. „htop“ will let you choose from a list of signals afterwards:

htop3.png

Of course you cannot kill processes that belong to your user when htop does not run as root (i.e. with „sudo“). „htop“ marks processes that belong to user it is run by with a brighter process id:

htop4.png

Sadfully this also means, that running htop as root/sudo, marks processes that belong to non-root with a darker grey. But hey, that’s a nice missing feature for patch, isn’t it?

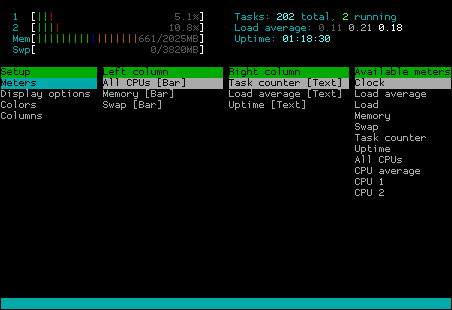
If you like to become an advanced htop user, you can check the „Setup“ menu (click it or press the „F2“ or „S“ key). You will see a menu for configuring the output of htop, enabling you to switch off and on the display of certain information:

htop5.png

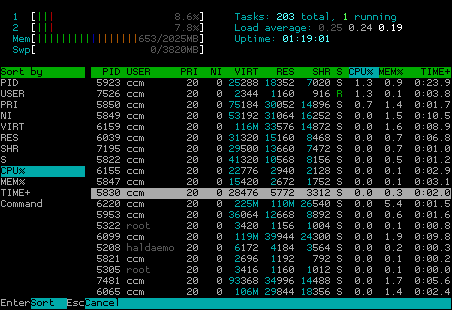
Of course you can also sort the process list (click „Sort“ or press „F6“) which give you a list of possible sort parameters:

htop6.png

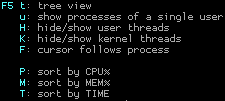
In spite of this, you can switch to a process tree display and sort it by pressing one of the keys showed below:

htop7.png

So let me give you a last nice gimmick and then end for today: You can try to attach „strace“ to a running process by marking the process typing „s“. If you don’t know, what strace is, don’t bother, if you do, you will probably like this feature pretty much.

I hope you got the clue about using htop, which is a really neat, full featured console top replacement that is even worth to be used when running X as it supports mouse usage and brings everything you need while still having a small footprint. If you have alternatives, you like mention, feel free to drop them as a comment.

my package of the day – mtr as a powerful and default alternative to traceroute

Know the situation? Something is wrong with the network or you are just curious and want to run a „traceroute“. At least under most Debian based systems your first session will probably look like this:

$ traceroute www.ubuntu.com
command not found: traceroute

Maybe on Ubuntu you will at least be hinted to install „traceroute“ or „traceroute-nanog“… To be honest, I really hate this lack of a basic tool and cannot even remember how often I typed „aptitude install traceroute“ afterwards (and press thumbs your network is up and running).

But sometimes you just need to dig a bit deeper and this time the surprise was really big as the incredible Mnemonikk told me about an alternative that is installed by default in Ubuntu and nearly no one knows about it: „mtr„, which is an abbreviation for „my traceroute“.

Let’s just check it by calling „mtr www.ubuntu.com“ (i slightly changed the output for security reasons):

                 My traceroute  [v0.72]
ccm        (0.0.0.0)          Wed Jun 20 6:51:20 2008
Keys:  Help   Display mode   Restart statistics   Order
of fields      Packets               Pings
 Host        Loss%   Snt   Last   Avg  Best  Wrst StDev
 1. 1.2.3.4   0.0%   331    0.3   0.3   0.3   0.5   0.0
 2. 2.3.4.5   0.0%   331   15.6  16.3  14.9  42.6   2.6
 3. 3.4.5.6   0.0%   330   15.0  15.5  14.4  58.5   2.7
 4. 4.5.6.7   0.0%   330   17.5  17.3  15.4  60.5   5.3
 5. 5.6.7.8   0.0%   330   15.7  24.3  15.6 212.3  30.2
 6. ae-32-52 58.8%   330   20.6  22.1  15.9  42.5   4.7
 7. ae-2.ebr 54.1%   330   20.6  25.0  19.0  45.4   4.7
 8. ae-1-100  0.0%   330   21.5  25.4  19.2  41.1   5.1
 9. ae-2.ebr  0.0%   330   27.5  34.0  26.7  73.5   5.2
10. ae-1-100  0.3%   330   28.8  33.6  26.7  72.5   6.0
11. ae-2.ebr  0.0%   330   30.8  32.9  26.7  48.5   5.0
12. ae-26-52  0.0%   330   27.6  34.8  26.9 226.8  26.8
13. 195.50.1  0.3%   330   27.7  28.4  27.2  42.5   1.7
14. gw0-0-gr  0.0%   330   27.9  28.1  27.0  40.5   1.4
15. avocado.  0.0%   330   27.8  28.0  27.2  36.2   1.0

You might notice, that the output is quite well formed („mtr“ uses curses for this). The interesting point is: Instead of running once, mtr continuously updates the output and statistics, providing you with a neat network overview. So you can use it as an enhanced ping showing all steps between you and the target.

For the sake of it: The package installed by default in Ubuntu is actually called „mtr-tiny“ as it lacks a graphical user interface. If you prefer a gui you can replace the package with „mtr“ by running „aptitude install mtr“. When running „mtr“ from the console afterwards you will be prompted with a gtk interface. In case you still want text mode, just append „–curses“ as a parameter.

Yes, that was a quick package, but if you keep it in mind, you will save time, you normalle spend for installing „traceroute“ and you’ll definitely have better results for network diagnose. Happy mtr’ing!

[update]

sherman noted, that the reason for traceroute not being installed is, that it’s just deprecated and „tracepath“ should be used instead. Thank you for the hint, though I’d prefer „mtr“ as it’s much more reliable and verbose.

Don’t complain about it – make it better? Bug Jamming for a better tomorrow

Agreed, that was too much pathetic. But you got the point, didn’t you? Free software like every software is full of bugs and possibilities for enhancements. So is Ubuntu. But that’s okay, because we have the power to change it. No need to be a developer, no need to be an ubernerd. All you have to do is to spent some time. Need somebody to motivate you? Want to do it in a group? Then a Bug Jam is perfect for you!

No, it’s not a jam made of bugs :) It’s a get together where people work on eliminating software bugs by spending some time reading bug descriptions, checking them, writing new ones, informing developers about bugs or even patch the software by themselves. The Ubuntu community crew tries to push these events as they really help you to kick your ass and just get started as it’s much easier to get into the bug business in a group and it makes a lot of fun. And of course bugs fixed in Ubuntu can be ported to Debian and upstream quite often.

All you for a Bug Jam is… Ah, just come to one of the four Bug Jam irc sessions taking place in the next weeks, held by some Ubuntu people who already have some experiences with Bug Jamming and Ubuntu related events (I will support Daniel Holbach on two of them, one this Friday, 16:00 UTC). See the schedule on Daniel’s blog entry.

And keep in mind:

1. There is the 5-a-day project where you and your loco team, group or whatever can make a difference and pop up on the first line of the statistics.

2. There will be a Global Bug Jam which will be the first and biggest of it’s kind so far and you can be part of it.

Hope to see you there.


My 5 today: #156204 (pidgin-otr), #130443 (pidgin-otr), #144770 (pidgin-otr), #240420 (ubuntu), #231660 (ubuntu)
Do 5 a day – every day! https://wiki.ubuntu.com/5-A-Day

my (not yet) package of the day – circular application menu

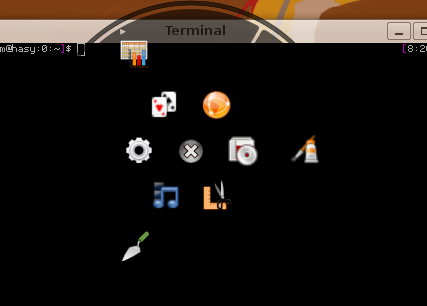
(Not yet a package, but still interesting enough to tell and hey: bleeding edge.) Circular Application Menu for Gnome is a Google Code hosted project providing a different access method to your Gnome menu. Actually all it does, is displaying the menu as circles:

hauptmenuecircular.png

Installation

But as it is different, it is somehow attractive and therefore let’s give it a try. Building „circular application menu“ is quite easy. You just have to install some libraries, subversion and essential build stuff, check out the current repository and compile it. Huh? Try this:

$ sudo aptitude install subversion build-essential \
libgnome-desktop-dev libgnome-menu-dev
$ svn checkout \
http://circular-application-menu.googlecode.com/svn/trunk/ \
circular-application-menu
$ cd circular-application-menu
$ make

Running

If no severe error occurred, you are already able to run „circular application menu“ it via ‚./circular-application-menu‘ now. Ignore error messages on the console as long as it comes up. Strange feeling to use it, isn’t it? I haven’t decided, if I really like it or not, until now.

If you like you can now install it to the system via make install, though I am fine with running it from the build directory, which I moved to „~/opt/circular/“. As it is pre-alpha-something, I just don’t want the code be mixed up with my distribution binaries.

Customizing

If you want to go one step further, install the Avant Window Navigator („$ sudo aptitude install avant-window-navigator“), the OS X style application panel, which just moved from Google Code to Launchpad (points taken!) and add an icon for circular menu to it by doing a right-click=>settings=>Launchers=>Add. Now you can start all normal applications by calling Circular Menues from the AvantGo launcher. Definitely an eye catcher:

Circular Application Menu combined with Avant Window Navigator
(click to enlarge)

Pitfalls

There are, of course, a couple of pitfalls. For instance, when running circular application menu on top of a dark or even black application, you cannot see it’s borders:

bildschirmfoto-1.png

Also, you currently don’t have the possibility to customize the launcher at all.

Nevertheless: circular application menu for Gnome is a nice desktop gimmick. I am sure, it will be packaged soon (will I?) and go to the community repositories of most GNU/Linux distributions.

First BBJ – Berlin Bug Jam – with MOTU Daniel Holbach on Monday, 16th of June at c-base Berlin

Ubuntu Berlin ist proud to present you the first BBJ: A „Berlin Bug Jam“ with Ubuntu MOTU Daniel Holbach, who will rock the place, for sure. Don’t know what a „Bug Jam“ is? Well, imagine it as a gettogether for working on bugs in a team. That does not mean, you have to be a developer: Everybody is welcome, who can do things from testing bug reports, triaging, patching or just wants to see how it all works. So this will rather be an „event“ than a lecture/workshop and provide you with a lot of fun and knowledge. If you want to see a detailed description of a bug jam, check the wiki page.On the BBJ, we will try to persuade to join the 5-A-Day project, motivating people to continuously enhance the Ubuntu Distribution and helping you to spread the word (and yes, to compete if you like) by trying to work on five bugs every day. Let’s see, if we succeed…

Feel free to bring your notebook along. We have power and free wifi, of course.

Event: 1. Berlin Bug Jam (BBJ) with Daniel Holbach
Location: c-base Berlin, Rungestr. 20
Date: 16th of June
Time: 18:00

Please note: If you want to support the Global Ubuntu Bug Jam, which is taking place from 8th to 10th of August,
this is a perfect possibility for you to gather some hands on
experiences. Of course, Ubuntu Berlin, will bring up a great lineup and
event for the Global Bug Jam. We are already working on it.